- 583
- 783
- Joined
- Sep 4, 2020
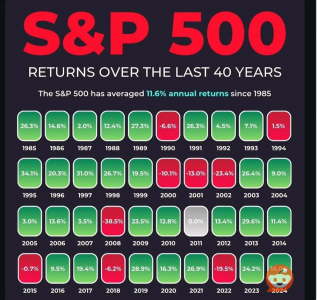
Yeah I just threw it together quickly to start to look at the timing and magnitude of a potential pullback using the most recent three corrections. All data is actual except for the bottom bolded line which is simple averages.The variants are part of the reason I started hedging. What’s that first chart? Is that a predictive indicator or something? Just curious how the construction of it came to be. I’ve got some “crash” puts for March that would be very lucrative if they printed


 watching the quality of the bounce.