antidope
Supporter
- 62,419
- 65,325
- Joined
- Jan 2, 2012
Why is scoring down recently in the NBA? A deep dive into the numbers behind the decline
After spending the bulk of the season at historic levels, scoring has declined since Feb. 1 and a lot of that starts at the free-throw line.
A midseason mystery has developed this NBA season. Suddenly, scoring is down. Way down.
After spending the bulk of the season at historically high levels, scoring has declined since the beginning of February. Through Jan. 21, teams were averaging 115.6 points per game (just under 231.2 total points per game). That would be the sixth-highest ever, and highest since 1969-70 when the league was playing about 20 possessions per game faster than it is today.
From Feb. 1 to March 17, that had dropped to 112.8 (225.5 points total). Even with the decrease, the league still has the highest points per possession on record (going back to 1972-73 per Basketball-Reference.com) by around 0.7 points/100 as compared to last season, and more than 3.2 points/100 higher than the third-most efficient season — 2020-21.
Still, the decline is doubly unusual because scoring almost always increases as a season progresses, with perhaps a slight dip around the trade deadline and All-Star break:

Data compiled by Seth Partnow from NBA.com
The main culprit? Free throws, or lack thereof. The average game through Jan. 31 saw the teams combine for 45.6 free-throw attempts/48 minutes. From Feb. 1 through March 17, that rate has declined to 40.1. Assuming those missing free throws would have been converted at league average rates, that directly accounts for close to 1.7 of the 5.7 points per game decline in overall scoring.
To slightly oversimplify, a possession ending in two FTA is worth around 1.6 points compared to a league-average possession being worth just over 1.1.
There has been reporting and rampant speculation about the degree to which league officials have or have not directed officials to alter the way they call games. I’m not able to adjudicate what forces are behind the change; rather, I want to illuminate the facts — which ultimately lead me to suspect that a small change in officiating has had wide-ranging effects on the game.
I should acknowledge up front that the stats are suggestive of a change in officiating but fall short of proof. While I believe there has been an observable difference, I’m reluctant to lean too heavily on that observation, especially considering the change itself has been somewhat small, on the order of one fewer shooting foul per team per game.
Both sources have dropped. Through January, NBA games averaged just under 20.5 shooting fouls called/48 minutes. From Feb. 1 to March 17 , this had dropped to just under 18.6/48.
Interestingly, the decline in “bonus” free-throw attempts is even larger on a percentage basis, the league having dropped from around 2.75 bonus foul trips (and thus 5.5 FTA) per 48 to a little more than 2.0 since the start of February. We can start to see some of the knock on effects of a more permissive game flow here, as each team is spending around one minute and 40 seconds less game time with the opponent in the penalty.
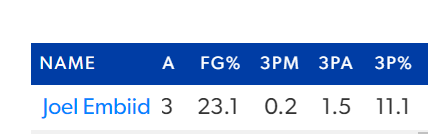
One such suggestion is that with noted foul drawers such as Joel Embiid and Trae Young sidelined for extended periods, it is natural we should see fewer fouls being drawn. There is some truth here.
If individual free-throw attempt rates had stayed constant before and after Jan. 31, around 17 percent of the decrease in overall attempts can be attributed to this factor. To put it another way, the NBA as a whole has attempted around 1,600 fewer total free throws since Feb. 1 than if attempt rates had stayed at the through-January mark. Around 275 of those “missing” attempts are a result of the change in who is on the floor.
At least at first pass. I think the above number is probably an overcount to some degree. When high-usage/high-foul draw rate players are absent, their scoring attempts don’t simply vanish. Rather, they are taken up by teammates who might draw fouls at a lower rate than an injured star, but will still draw some fouls. Even the team most affected by player absences, the 76ers, have seen their FTA/G decrease by nearly 8.8 FTA/G. Embiid was averaging 11.9 FTA/G on his own, so clearly there is some degree of replacement level free-throw production happening. Still, even accounting for that, I’m comfortable positing that about 12-15 percent of the leaguewide decrease is simply certain players being out.
Drops in either transition play opportunities or offensive rebounding could also explain some of the free-throw decline, as fast breaks and putbacks tend to result in free throws at a higher rate than do offensive chances overall.
According to Cleaning the Glass, there has been a modest decrease in transition play, with 15.1 percent of scoring attempts coming in transition through January, but only 14.8 percent since. Similarly, there has been a slight decrease in offensive rebounding league wide, 24.6 percent through Jan. 31 compared to 23.8 percent in the ensuing month-and-a-half. While these changes are in the right direction to cause a reduction in free-throw attempt rates, the size of them aren’t nearly sufficient to explain the bulk of the drop we’ve seen.
Fouls drawn by shot location
[TABLE]
[TR]
[TH]ZONE
▼[/TH]
[TH]BEFORE FEB 1
[/TH]
[TH]POST FEB 1
[/TH]
[TH]DECLINE
[/TH]
[/TR]
[TR]
[TD]Restricted area[/TD]
[TD]16.10%[/TD]
[TD]14.91%[/TD]
[TD]7.40%[/TD]
[/TR]
[TR]
[TD]Midrange[/TD]
[TD]7.48%[/TD]
[TD]6.68%[/TD]
[TD]10.60%[/TD]
[/TR]
[TR]
[TD]In the paint (non-RA)[/TD]
[TD]20.48%[/TD]
[TD]18.68%[/TD]
[TD]8.80%[/TD]
[/TR]
[TR]
[TD]Above-the-break 3[/TD]
[TD]1.05%[/TD]
[TD]1.01%[/TD]
[TD]3.60%[/TD]
[/TR]
[TR]
[TD]Corner 3[/TD]
[TD]0.69%[/TD]
[TD]0.48%[/TD]
[TD]29.60%[/TD]
[/TR]
[/TABLE]
Across 2-point territory, the largest overall drop has come in “floater range” — the non-restricted area portion of the paint. Matched with the decline in foul rates on drives, this is again suggestive of, without directly proving, a reinterpretation of “defensive freedom of movement.”
Through Jan. 31, fouls had been whistled in favor of the offensive player on just under 7.5 percent of events classified as “drives” by NBA.com tracking data. Since Feb. 1, that rate has declined to just above 6.5 percent. As with overall free-throw attempts, who is doing the driving tells part of the story. Embiid and Young are both high-volume drivers who have drawn fouls at above average rates and have either barely played (Young) or not appeared at all (Embiid) from February on.
If foul rates on drives had stayed constant, there would have been about 250 more fouls called since Feb. 1. Around 30 of that 250, or 12 percent of the decrease, can be attributed to the identity of the average driver. This is probably a better estimate of how much of the decline in free-throw attempts is the result of injured and/or otherwise absent star players than the 17 percent I referenced earlier.
The bulk of the rest results from a slightly slower pace of play. According to data collated by Mike Beuoy of Inpredictable.com, the average possession featuring free throws is around three seconds shorter than a possession where no free throws are attempted. On its own, this would only produce a small impact on overall pace, as we’re talking about maybe 10 seconds per game total.
However, Beuoy has also found that both free-throw and non-free-throw possessions are lasting slightly longer after Feb. 1 than they were through the end of January, making the average possession in each group around .15 seconds longer on average. That might not seem like much, but over a full game, the combination of a couple fewer free-throw possessions with the lengthening of possessions of all types equates to a pace of play of around two fewer possessions per 48 minutes for each team, which roughly accounts for the remaining four points per game of the offensive decline.
I’d suggest the longer possessions themselves illustrate how a slightly reduced foul rate can help defenses force offenses to go a little deeper into possessions, in effect slowing the entire pace of the game in a way that might not be perceptible to the naked eye, but shows up once we zoom out a little.
Milwaukee’s Damian Lillard has seen his free-throw attempts drop in the last few weeks. (Troy Taormina / USA Today)
Further, many of the individual changes in free-throw attempt rates have much more to do with changing circumstances than with any league-wide trends.
For example, Grant Williams has seen one of the largest increases in free-throw attempts, but he also has had the ball in his hands substantially more often in Charlotte (10.0 percent time of possession) than he did in Dallas (a paltry 6.1 percent) playing alongside the extremely ball dominant Luka Dončić. Williams’ offensive role has become commensurately larger as well (19.9 usage in Charlotte compared to 13.8 in Dallas).
On the other side of the ledger, Spencer Dinwiddie has unsurprisingly seen the ball far less after moving from Brooklyn to orbiting around LeBron James in the Lakers’ solar system, with time of possession percentage declining from 29.9 percent to 11.2 percent. He has seen a steep decrease in foul drawing as well.
That said, the rainy day officiating we’re seeing now has impacted players differently.
Of the 149 players who played at least 800 minutes through Jan. 31 and 400 from Feb. 1 to March 17, 91 have seen a per-game decline in free-throw attempts, while 98 have seen a per-minute decline. There are a few players who have actually seen their FT rate tick upwards, which is to be expected. Most notably, DeMar DeRozan is taking nearly 3.1 more free-throw attempts per game since Feb. 1 than he did through January. Williams and Kelly Oubre, a recipient of a lot of Embiid’s scoring chances, have also seen large increases.
On the downside, the two most affected players have been Damian Lillard and Stephen Curry, each down about three free-throw attempts per game. They are followed by Dinwiddie, Bam Adebayo and De’Aaron Fox, all of whom have seen a decrease of more than two attempts per game. There doesn’t appear to be an obvious pattern in terms of which players have seen the largest declines. Among players with some degree of a rep for foul baiting, James Harden, Jalen Brunson and Immanuel Quickley have all seen slight increases in free-throw attempts, while Dončić and Austin Reaves have dropped off by 1.6 free-throw attempts per game and 1.0 free-throw attempts per game, respectively.
First, as mentioned previously, the data taken as a whole is quite suggestive of some modification in how certain situations have been officiated over the last several weeks. This has naturally affected certain players and teams more than others, perhaps in ways we will continue to see shake out over the remaining regular season into the playoffs.
The second bit is perhaps more interesting. The complexity of the overall system means that a relatively minor change — essentially a single shooting foul per team per game — has had an outsized impact, with the overall decline in scoring multiple times larger than simply the extra free throws at issue.
As a final note, we’ve seen “points of emphasis” have impacts over the short term before. Often these occur at the beginning of a season, where a certain violation or other call is made at elevated rates for a few weeks before settling back to historical trends. The foul dip and related scoring decline has already lasted longer than those situations have tended to, as the effect usually fades after around a month.
It remains to be seen if it does persist for the rest of the regular season and, if so, how that might carry into the postseason.
After spending the bulk of the season at historically high levels, scoring has declined since the beginning of February. Through Jan. 21, teams were averaging 115.6 points per game (just under 231.2 total points per game). That would be the sixth-highest ever, and highest since 1969-70 when the league was playing about 20 possessions per game faster than it is today.
From Feb. 1 to March 17, that had dropped to 112.8 (225.5 points total). Even with the decrease, the league still has the highest points per possession on record (going back to 1972-73 per Basketball-Reference.com) by around 0.7 points/100 as compared to last season, and more than 3.2 points/100 higher than the third-most efficient season — 2020-21.
Still, the decline is doubly unusual because scoring almost always increases as a season progresses, with perhaps a slight dip around the trade deadline and All-Star break:

Data compiled by Seth Partnow from NBA.com
The main culprit? Free throws, or lack thereof. The average game through Jan. 31 saw the teams combine for 45.6 free-throw attempts/48 minutes. From Feb. 1 through March 17, that rate has declined to 40.1. Assuming those missing free throws would have been converted at league average rates, that directly accounts for close to 1.7 of the 5.7 points per game decline in overall scoring.
To slightly oversimplify, a possession ending in two FTA is worth around 1.6 points compared to a league-average possession being worth just over 1.1.
There has been reporting and rampant speculation about the degree to which league officials have or have not directed officials to alter the way they call games. I’m not able to adjudicate what forces are behind the change; rather, I want to illuminate the facts — which ultimately lead me to suspect that a small change in officiating has had wide-ranging effects on the game.
I should acknowledge up front that the stats are suggestive of a change in officiating but fall short of proof. While I believe there has been an observable difference, I’m reluctant to lean too heavily on that observation, especially considering the change itself has been somewhat small, on the order of one fewer shooting foul per team per game.
Fewer free throws overall
So where has this decline in free-throw attempts occurred? Though there has been a drop in technical free throws of all types — both in the player and of the team/defensive 3-seconds varieties — the vast majority of NBA freebies come from either shooting fouls or team fouls committed while in the bonus.Both sources have dropped. Through January, NBA games averaged just under 20.5 shooting fouls called/48 minutes. From Feb. 1 to March 17 , this had dropped to just under 18.6/48.
Interestingly, the decline in “bonus” free-throw attempts is even larger on a percentage basis, the league having dropped from around 2.75 bonus foul trips (and thus 5.5 FTA) per 48 to a little more than 2.0 since the start of February. We can start to see some of the knock on effects of a more permissive game flow here, as each team is spending around one minute and 40 seconds less game time with the opponent in the penalty.
But why? Alternative explanations
As noted, the decline in free throws is suggestive in its own right, but there are a number of possible factors that could cause a decline in foul rates, either in whole or at least in part that have little to do with officiating, per se.One such suggestion is that with noted foul drawers such as Joel Embiid and Trae Young sidelined for extended periods, it is natural we should see fewer fouls being drawn. There is some truth here.
If individual free-throw attempt rates had stayed constant before and after Jan. 31, around 17 percent of the decrease in overall attempts can be attributed to this factor. To put it another way, the NBA as a whole has attempted around 1,600 fewer total free throws since Feb. 1 than if attempt rates had stayed at the through-January mark. Around 275 of those “missing” attempts are a result of the change in who is on the floor.
At least at first pass. I think the above number is probably an overcount to some degree. When high-usage/high-foul draw rate players are absent, their scoring attempts don’t simply vanish. Rather, they are taken up by teammates who might draw fouls at a lower rate than an injured star, but will still draw some fouls. Even the team most affected by player absences, the 76ers, have seen their FTA/G decrease by nearly 8.8 FTA/G. Embiid was averaging 11.9 FTA/G on his own, so clearly there is some degree of replacement level free-throw production happening. Still, even accounting for that, I’m comfortable positing that about 12-15 percent of the leaguewide decrease is simply certain players being out.
Drops in either transition play opportunities or offensive rebounding could also explain some of the free-throw decline, as fast breaks and putbacks tend to result in free throws at a higher rate than do offensive chances overall.
According to Cleaning the Glass, there has been a modest decrease in transition play, with 15.1 percent of scoring attempts coming in transition through January, but only 14.8 percent since. Similarly, there has been a slight decrease in offensive rebounding league wide, 24.6 percent through Jan. 31 compared to 23.8 percent in the ensuing month-and-a-half. While these changes are in the right direction to cause a reduction in free-throw attempt rates, the size of them aren’t nearly sufficient to explain the bulk of the drop we’ve seen.
Where are the missing free throws?
As noted above, around two-thirds of the decline in free-throw attempts are the result of a decrease in shooting fouls. This decrease is spread fairly evenly across shot zones, at least those inside the arc. Foul-draw rates on above the break 3s have only declined modestly, while the low base rate of fouls called on corner 3s makes the percentage change seem much more extreme than it is — the nearly 30 percent decline equates to around five fewer foul calls in total since the turn of February.Fouls drawn by shot location
[TABLE]
[TR]
[TH]ZONE
▼[/TH]
[TH]BEFORE FEB 1
[/TH]
[TH]POST FEB 1
[/TH]
[TH]DECLINE
[/TH]
[/TR]
[TR]
[TD]Restricted area[/TD]
[TD]16.10%[/TD]
[TD]14.91%[/TD]
[TD]7.40%[/TD]
[/TR]
[TR]
[TD]Midrange[/TD]
[TD]7.48%[/TD]
[TD]6.68%[/TD]
[TD]10.60%[/TD]
[/TR]
[TR]
[TD]In the paint (non-RA)[/TD]
[TD]20.48%[/TD]
[TD]18.68%[/TD]
[TD]8.80%[/TD]
[/TR]
[TR]
[TD]Above-the-break 3[/TD]
[TD]1.05%[/TD]
[TD]1.01%[/TD]
[TD]3.60%[/TD]
[/TR]
[TR]
[TD]Corner 3[/TD]
[TD]0.69%[/TD]
[TD]0.48%[/TD]
[TD]29.60%[/TD]
[/TR]
[/TABLE]
Across 2-point territory, the largest overall drop has come in “floater range” — the non-restricted area portion of the paint. Matched with the decline in foul rates on drives, this is again suggestive of, without directly proving, a reinterpretation of “defensive freedom of movement.”
Through Jan. 31, fouls had been whistled in favor of the offensive player on just under 7.5 percent of events classified as “drives” by NBA.com tracking data. Since Feb. 1, that rate has declined to just above 6.5 percent. As with overall free-throw attempts, who is doing the driving tells part of the story. Embiid and Young are both high-volume drivers who have drawn fouls at above average rates and have either barely played (Young) or not appeared at all (Embiid) from February on.
If foul rates on drives had stayed constant, there would have been about 250 more fouls called since Feb. 1. Around 30 of that 250, or 12 percent of the decrease, can be attributed to the identity of the average driver. This is probably a better estimate of how much of the decline in free-throw attempts is the result of injured and/or otherwise absent star players than the 17 percent I referenced earlier.
Second-order effects
Around a third of the decline in per game scoring is directly attributable to fewer free throws being awarded.The bulk of the rest results from a slightly slower pace of play. According to data collated by Mike Beuoy of Inpredictable.com, the average possession featuring free throws is around three seconds shorter than a possession where no free throws are attempted. On its own, this would only produce a small impact on overall pace, as we’re talking about maybe 10 seconds per game total.
However, Beuoy has also found that both free-throw and non-free-throw possessions are lasting slightly longer after Feb. 1 than they were through the end of January, making the average possession in each group around .15 seconds longer on average. That might not seem like much, but over a full game, the combination of a couple fewer free-throw possessions with the lengthening of possessions of all types equates to a pace of play of around two fewer possessions per 48 minutes for each team, which roughly accounts for the remaining four points per game of the offensive decline.
I’d suggest the longer possessions themselves illustrate how a slightly reduced foul rate can help defenses force offenses to go a little deeper into possessions, in effect slowing the entire pace of the game in a way that might not be perceptible to the naked eye, but shows up once we zoom out a little.

Milwaukee’s Damian Lillard has seen his free-throw attempts drop in the last few weeks. (Troy Taormina / USA Today)
Who benefits?
While some players appear to have been affected more than others — we’ll name names in a second — this is only natural. Changes in the playing environment are naturally going to advantage certain skill sets and players over others. Rather than assume anything conspiratorial, it is generally best to view officiating guidelines as being akin to the weather.Further, many of the individual changes in free-throw attempt rates have much more to do with changing circumstances than with any league-wide trends.
For example, Grant Williams has seen one of the largest increases in free-throw attempts, but he also has had the ball in his hands substantially more often in Charlotte (10.0 percent time of possession) than he did in Dallas (a paltry 6.1 percent) playing alongside the extremely ball dominant Luka Dončić. Williams’ offensive role has become commensurately larger as well (19.9 usage in Charlotte compared to 13.8 in Dallas).
On the other side of the ledger, Spencer Dinwiddie has unsurprisingly seen the ball far less after moving from Brooklyn to orbiting around LeBron James in the Lakers’ solar system, with time of possession percentage declining from 29.9 percent to 11.2 percent. He has seen a steep decrease in foul drawing as well.
That said, the rainy day officiating we’re seeing now has impacted players differently.
Of the 149 players who played at least 800 minutes through Jan. 31 and 400 from Feb. 1 to March 17, 91 have seen a per-game decline in free-throw attempts, while 98 have seen a per-minute decline. There are a few players who have actually seen their FT rate tick upwards, which is to be expected. Most notably, DeMar DeRozan is taking nearly 3.1 more free-throw attempts per game since Feb. 1 than he did through January. Williams and Kelly Oubre, a recipient of a lot of Embiid’s scoring chances, have also seen large increases.
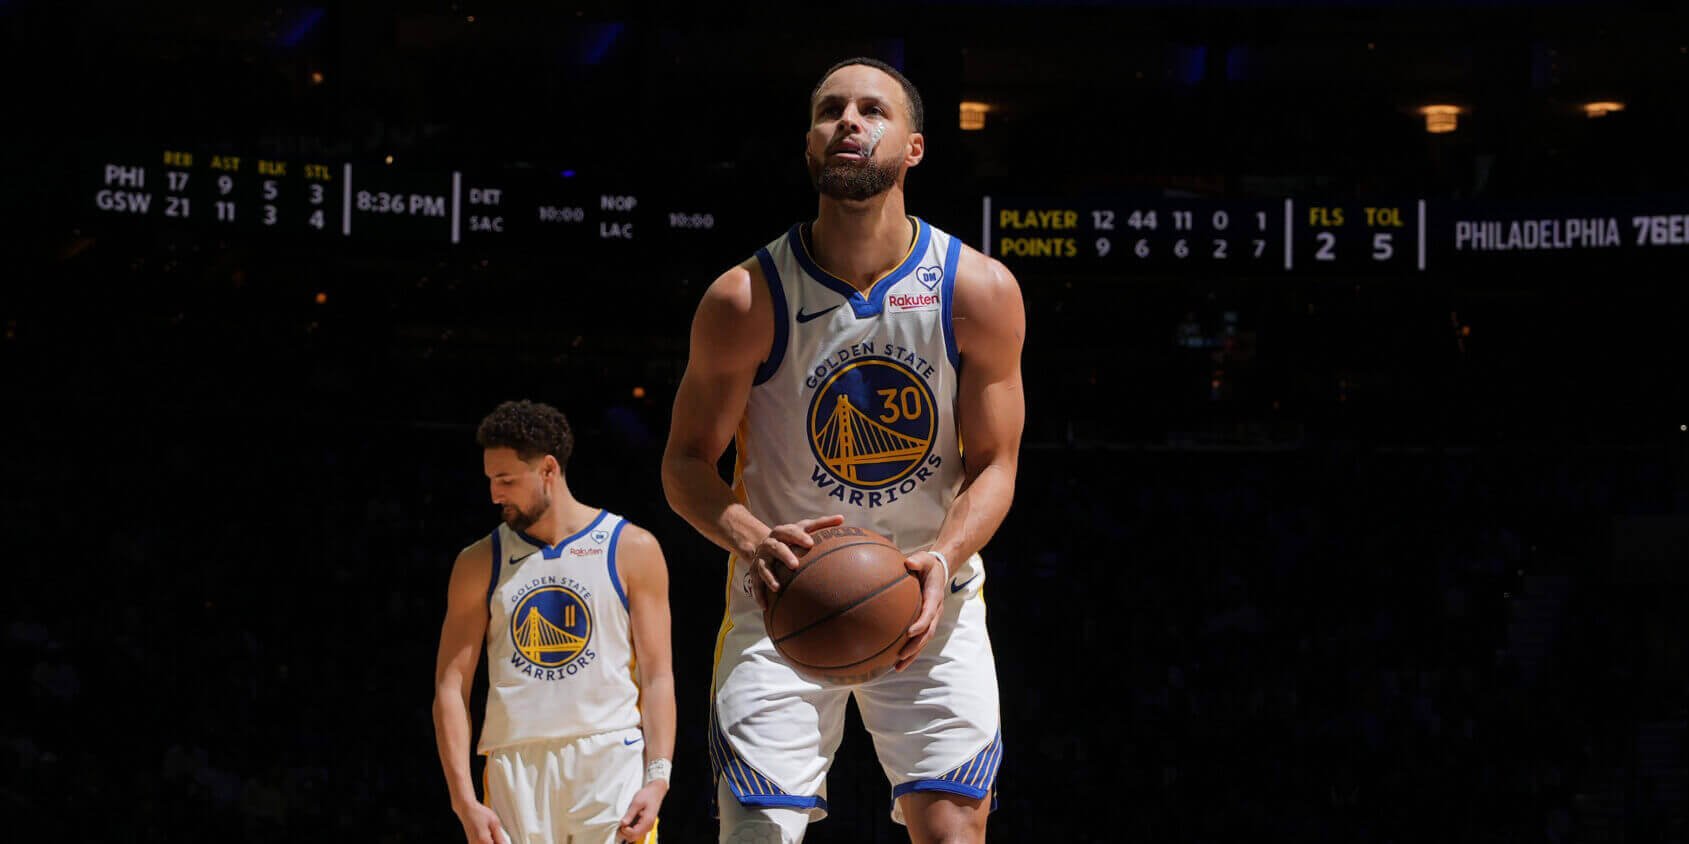
On the downside, the two most affected players have been Damian Lillard and Stephen Curry, each down about three free-throw attempts per game. They are followed by Dinwiddie, Bam Adebayo and De’Aaron Fox, all of whom have seen a decrease of more than two attempts per game. There doesn’t appear to be an obvious pattern in terms of which players have seen the largest declines. Among players with some degree of a rep for foul baiting, James Harden, Jalen Brunson and Immanuel Quickley have all seen slight increases in free-throw attempts, while Dončić and Austin Reaves have dropped off by 1.6 free-throw attempts per game and 1.0 free-throw attempts per game, respectively.
So what does it all mean?
For me, the salient aspects are two-fold.First, as mentioned previously, the data taken as a whole is quite suggestive of some modification in how certain situations have been officiated over the last several weeks. This has naturally affected certain players and teams more than others, perhaps in ways we will continue to see shake out over the remaining regular season into the playoffs.
The second bit is perhaps more interesting. The complexity of the overall system means that a relatively minor change — essentially a single shooting foul per team per game — has had an outsized impact, with the overall decline in scoring multiple times larger than simply the extra free throws at issue.
As a final note, we’ve seen “points of emphasis” have impacts over the short term before. Often these occur at the beginning of a season, where a certain violation or other call is made at elevated rates for a few weeks before settling back to historical trends. The foul dip and related scoring decline has already lasted longer than those situations have tended to, as the effect usually fades after around a month.
It remains to be seen if it does persist for the rest of the regular season and, if so, how that might carry into the postseason.